Identifying Effect using ID Algorithm#
This is a tutorial notebook for using the ID Algorithm in the causal identification step of causal inference.
Link to paper: https://ftp.cs.ucla.edu/pub/stat_ser/shpitser-thesis.pdf The pseudo code has been provided on Pg 40.
[1]:
from dowhy import CausalModel
import pandas as pd
import numpy as np
from IPython.display import Image, display
Examples#
The following sections show the working of the ID Algorithm on multiple test cases. In the graphs, T denotes the treatment variable, Y denotes the outcome variable and the Xs are additional variables.
Case 1#
This example exhibits the performance of the algorithm on the simplest possible graph.
[2]:
# Random data
treatment = "T"
outcome = "Y"
causal_graph = "digraph{T->Y;}"
columns = list(treatment) + list(outcome)
df = pd.DataFrame(columns=columns)

# Causal Model Initialization
causal_model = CausalModel(df, treatment, outcome, graph=causal_graph)

# View graph
causal_model.view_model()
from IPython.display import Image, display
print("Graph:")
display(Image(filename="causal_model.png"))

# Causal Identification using the ID Algorithm
identified_estimand = causal_model.identify_effect(method_name="id-algorithm")
print("\nResult for identification using ID Algorithm:")
print(identified_estimand)
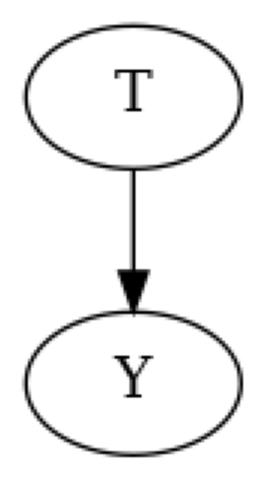
Graph:

Result for identification using ID Algorithm:
Predictor: P(Y|T)
Case 2#
This example exhibits the performance of the algorithm on a cyclic graph. This example demonstrates that a directed acyclic graph (DAG) is needed for the ID algorithm.
[3]:
# Random data
treatment = "T"
outcome = "Y"
causal_graph = "digraph{T->Y; Y->T;}"
columns = list(treatment) + list(outcome)
df = pd.DataFrame(columns=columns)

# Causal Model Initialization
causal_model = CausalModel(df, treatment, outcome, graph=causal_graph)

# View graph
causal_model.view_model()
from IPython.display import Image, display
print("Graph:")
display(Image(filename="causal_model.png"))

try:
    # Causal Identification using the ID Algorithm
    identified_estimand = causal_model.identify_effect(method_name="id-algorithm")
    print("\nResult for identification using ID Algorithm:")
    print(identified_estimand)
except:
    print("Identification Failed: The graph must be a directed acyclic graph (DAG).")
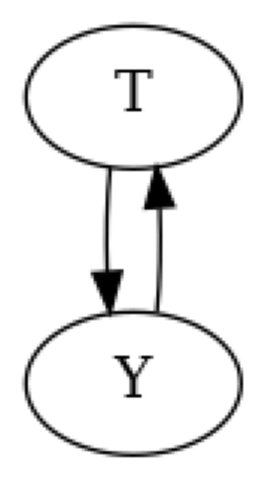
Graph:

Identification Failed: The graph must be a directed acyclic graph (DAG).
Case 3#
This example exhibits the performance of the algorithm in the presence of a mediator variable(X1).
[4]:
# Random data
treatment = "T"
outcome = "Y"
variables = ["X1"]
causal_graph = "digraph{T->X1;X1->Y;}"
columns = list(treatment) + list(outcome) + list(variables)
df = pd.DataFrame(columns=columns)

# Causal Model Initialization
causal_model = CausalModel(df, treatment, outcome, graph=causal_graph)

# View graph
causal_model.view_model()
from IPython.display import Image, display
print("Graph:")
display(Image(filename="causal_model.png"))

# Causal Identification using the ID Algorithm
identified_estimand = causal_model.identify_effect(method_name="id-algorithm")
print("\nResult for identification using ID Algorithm:")
print(identified_estimand)
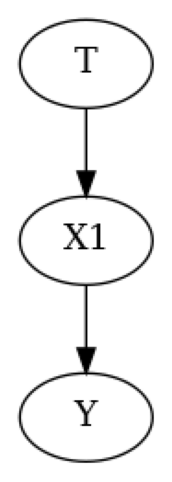
Graph:

Result for identification using ID Algorithm:
Sum over {X1}:
        Predictor: P(X1|T)
        Predictor: P(Y|T,X1)
Case 4#
The example exhibits the performance of the algorithm in the presence of a direct and indirect path(through X1) from T to Y.
[5]:
# Random data
treatment = "T"
outcome = "Y"
variables = ["X1"]
causal_graph = "digraph{T->Y;T->X1;X1->Y;}"
columns = list(treatment) + list(outcome) + list(variables)
df = pd.DataFrame(columns=columns)

# Causal Model Initialization
causal_model = CausalModel(df, treatment, outcome, graph=causal_graph)

# View graph
causal_model.view_model()
from IPython.display import Image, display
print("Graph:")
display(Image(filename="causal_model.png"))

# Causal Identification using the ID Algorithm
identified_estimand = causal_model.identify_effect(method_name="id-algorithm")
print("\nResult for identification using ID Algorithm:")
print(identified_estimand)
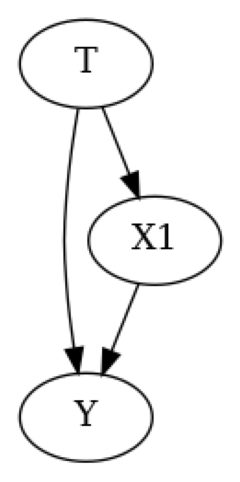
Graph:
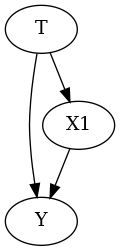
Result for identification using ID Algorithm:
Sum over {X1}:
        Predictor: P(Y|T,X1)
        Predictor: P(X1|T)
Case 5#
This example exhibits the performance of the algorithm in the presence of a confounding variable(X1) and an instrumental variable(X2).
[6]:
# Random data
treatment = "T"
outcome = "Y"
variables = ["X1", "X2"]
causal_graph = "digraph{T->Y;X1->T;X1->Y;X2->T;}"
columns = list(treatment) + list(outcome) + list(variables)
df = pd.DataFrame(columns=columns)

# Causal Model Initialization
causal_model = CausalModel(df, treatment, outcome, graph=causal_graph)

# View graph
causal_model.view_model()
from IPython.display import Image, display
print("Graph:")
display(Image(filename="causal_model.png"))

# Causal Identification using the ID Algorithm
identified_estimand = causal_model.identify_effect(method_name="id-algorithm")
print("\nResult for identification using ID Algorithm:")
print(identified_estimand)
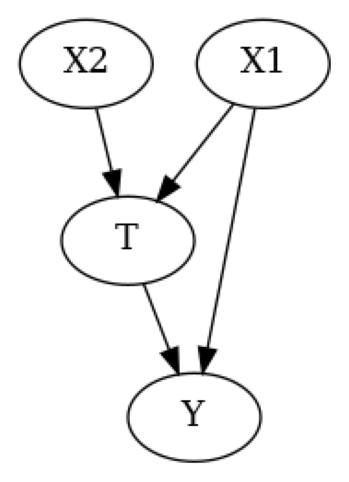
Graph:
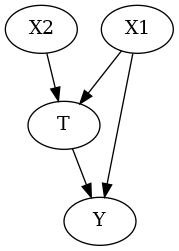
Result for identification using ID Algorithm:
Sum over {X1}:
        Predictor: P(Y|X1,X2,T)
        Predictor: P(X1)
Case 6#
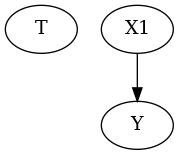
This example exhibits the performance of the algorithm in case of a disjoint graph.
[7]:
# Random data
treatment = "T"
outcome = "Y"
variables = ["X1"]
causal_graph = "digraph{T;X1->Y;}"
columns = list(treatment) + list(outcome) + list(variables)
df = pd.DataFrame(columns=columns)

# Causal Model Initialization
causal_model = CausalModel(df, treatment, outcome, graph=causal_graph)

# View graph
causal_model.view_model()
from IPython.display import Image, display
print("Graph:")
display(Image(filename="causal_model.png"))

# Causal Identification using the ID Algorithm
identified_estimand = causal_model.identify_effect(method_name="id-algorithm")
print("\nResult for identification using ID Algorithm:")
print(identified_estimand)
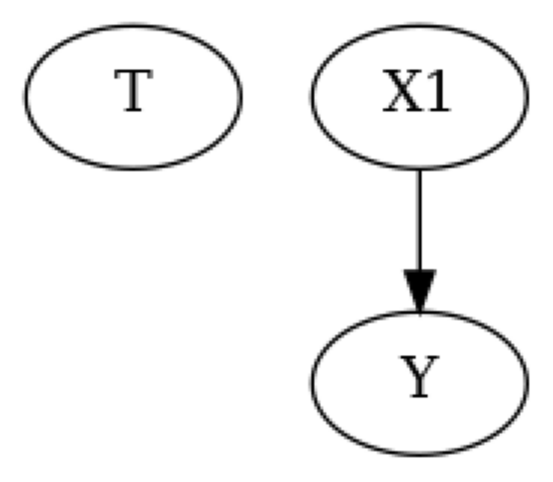
Graph:
Result for identification using ID Algorithm:
Sum over {X1}:
        Predictor: P(X1,Y)
[ ]: