pywhy_graphs.viz.timeseries_layout#
- pywhy_graphs.viz.timeseries_layout(G, variable_order=None, scale=5, center=None, aspect_ratio=1.3333333333333333)[source]#
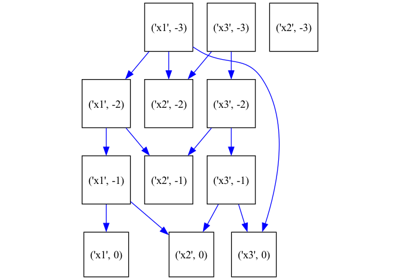
Position nodes in a time-series layout from left to right with lags as columns.
- Parameters:
G : TimeSeriesGraph
A timeseries graph.
variable_order : list, optional
List of variables in
Gto order from top to bottom, by default None, which would be a random order.scale : int, optional
Scale factor for positions, by default 5.
center : ArrayLike, optional
The 2D array of the center, by default None, which will plot around the point (0, 0).
aspect_ratio : float, optional
The ratio of the width to the height of the layout, by default 4/3.
- Returns:
pos : dict
A dictionary of positions keyed by node.
Notes
The time-series layout lays out nodes from historical lags to the present (i.e. max-lag to t=0) in left to right fashion. It also keeps each row set as a specific time-series variable.
Examples using pywhy_graphs.viz.timeseries_layout#
Drawing timeseries graphs and setting their layout