Note
Go to the end to download the full example code.
Drawing timeseries graphs and setting their layout#
One can draw timeseries graphs without setting the pos argument,
in that case graphviz will choose how to place the nodes. This can look rather
messy in the final output.
In this example, we demonstrate how to visualize timeseries graphs effectively.
For comparing different graphs with the same layout, see Drawing graphs and setting their layout for visual comparison
from pywhy_graphs import StationaryTimeSeriesDiGraph
from pywhy_graphs.viz import draw, timeseries_layout

# create some dummy graphs: G, admg, cpdag, and pag
# this code is borrowed from the other example: intro_causal_graphs.py ;)
G = StationaryTimeSeriesDiGraph(max_lag=3)
ts_edges = [
    (("x1", -1), ("x1", 0)),
    (("x1", -1), ("x2", 0)),
    (("x3", -1), ("x2", 0)),
    (("x3", -1), ("x3", 0)),
    (("x1", -3), ("x3", 0)),
]
G.add_edges_from(ts_edges)
First we will draw the graph without setting positions
dot_G = draw(G)

# render the graphs using graphviz render() function
dot_G.render(outfile="default_G.png", view=True)
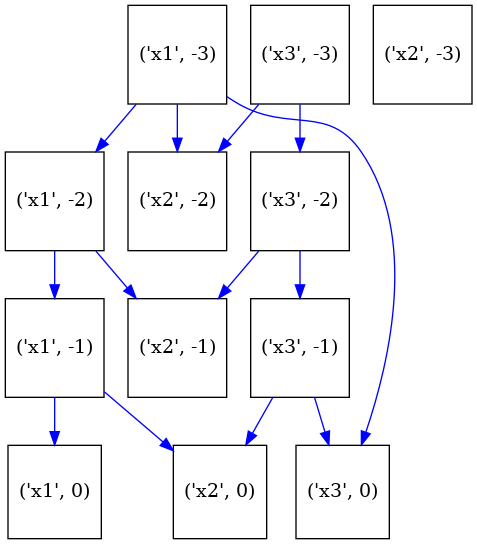
'default_G.png'
Next, we will set positions using the pywhy_graphs.viz.timeseries_layout function,
which creates a nice default layout for time-series graphs.
# get the layout position for the graph G using networkx
pos_G = timeseries_layout(G, variable_order=["x1", "x2", "x3"], scale=10)

# let us inspect the positions.
# Notice that networkx and graphviz related software store positions as
# a dictionary keyed by node with (x, y) coordinates as values.
print(pos_G)

# draw the graphs (i.e., generate a graphviz object that can be rendered)
# each time we call draw() we pass the layout position of G
dot_G = draw(G, pos=pos_G)

# render the graphs using graphviz render() function
dot_G.render(outfile="G.png", view=True, engine="neato")
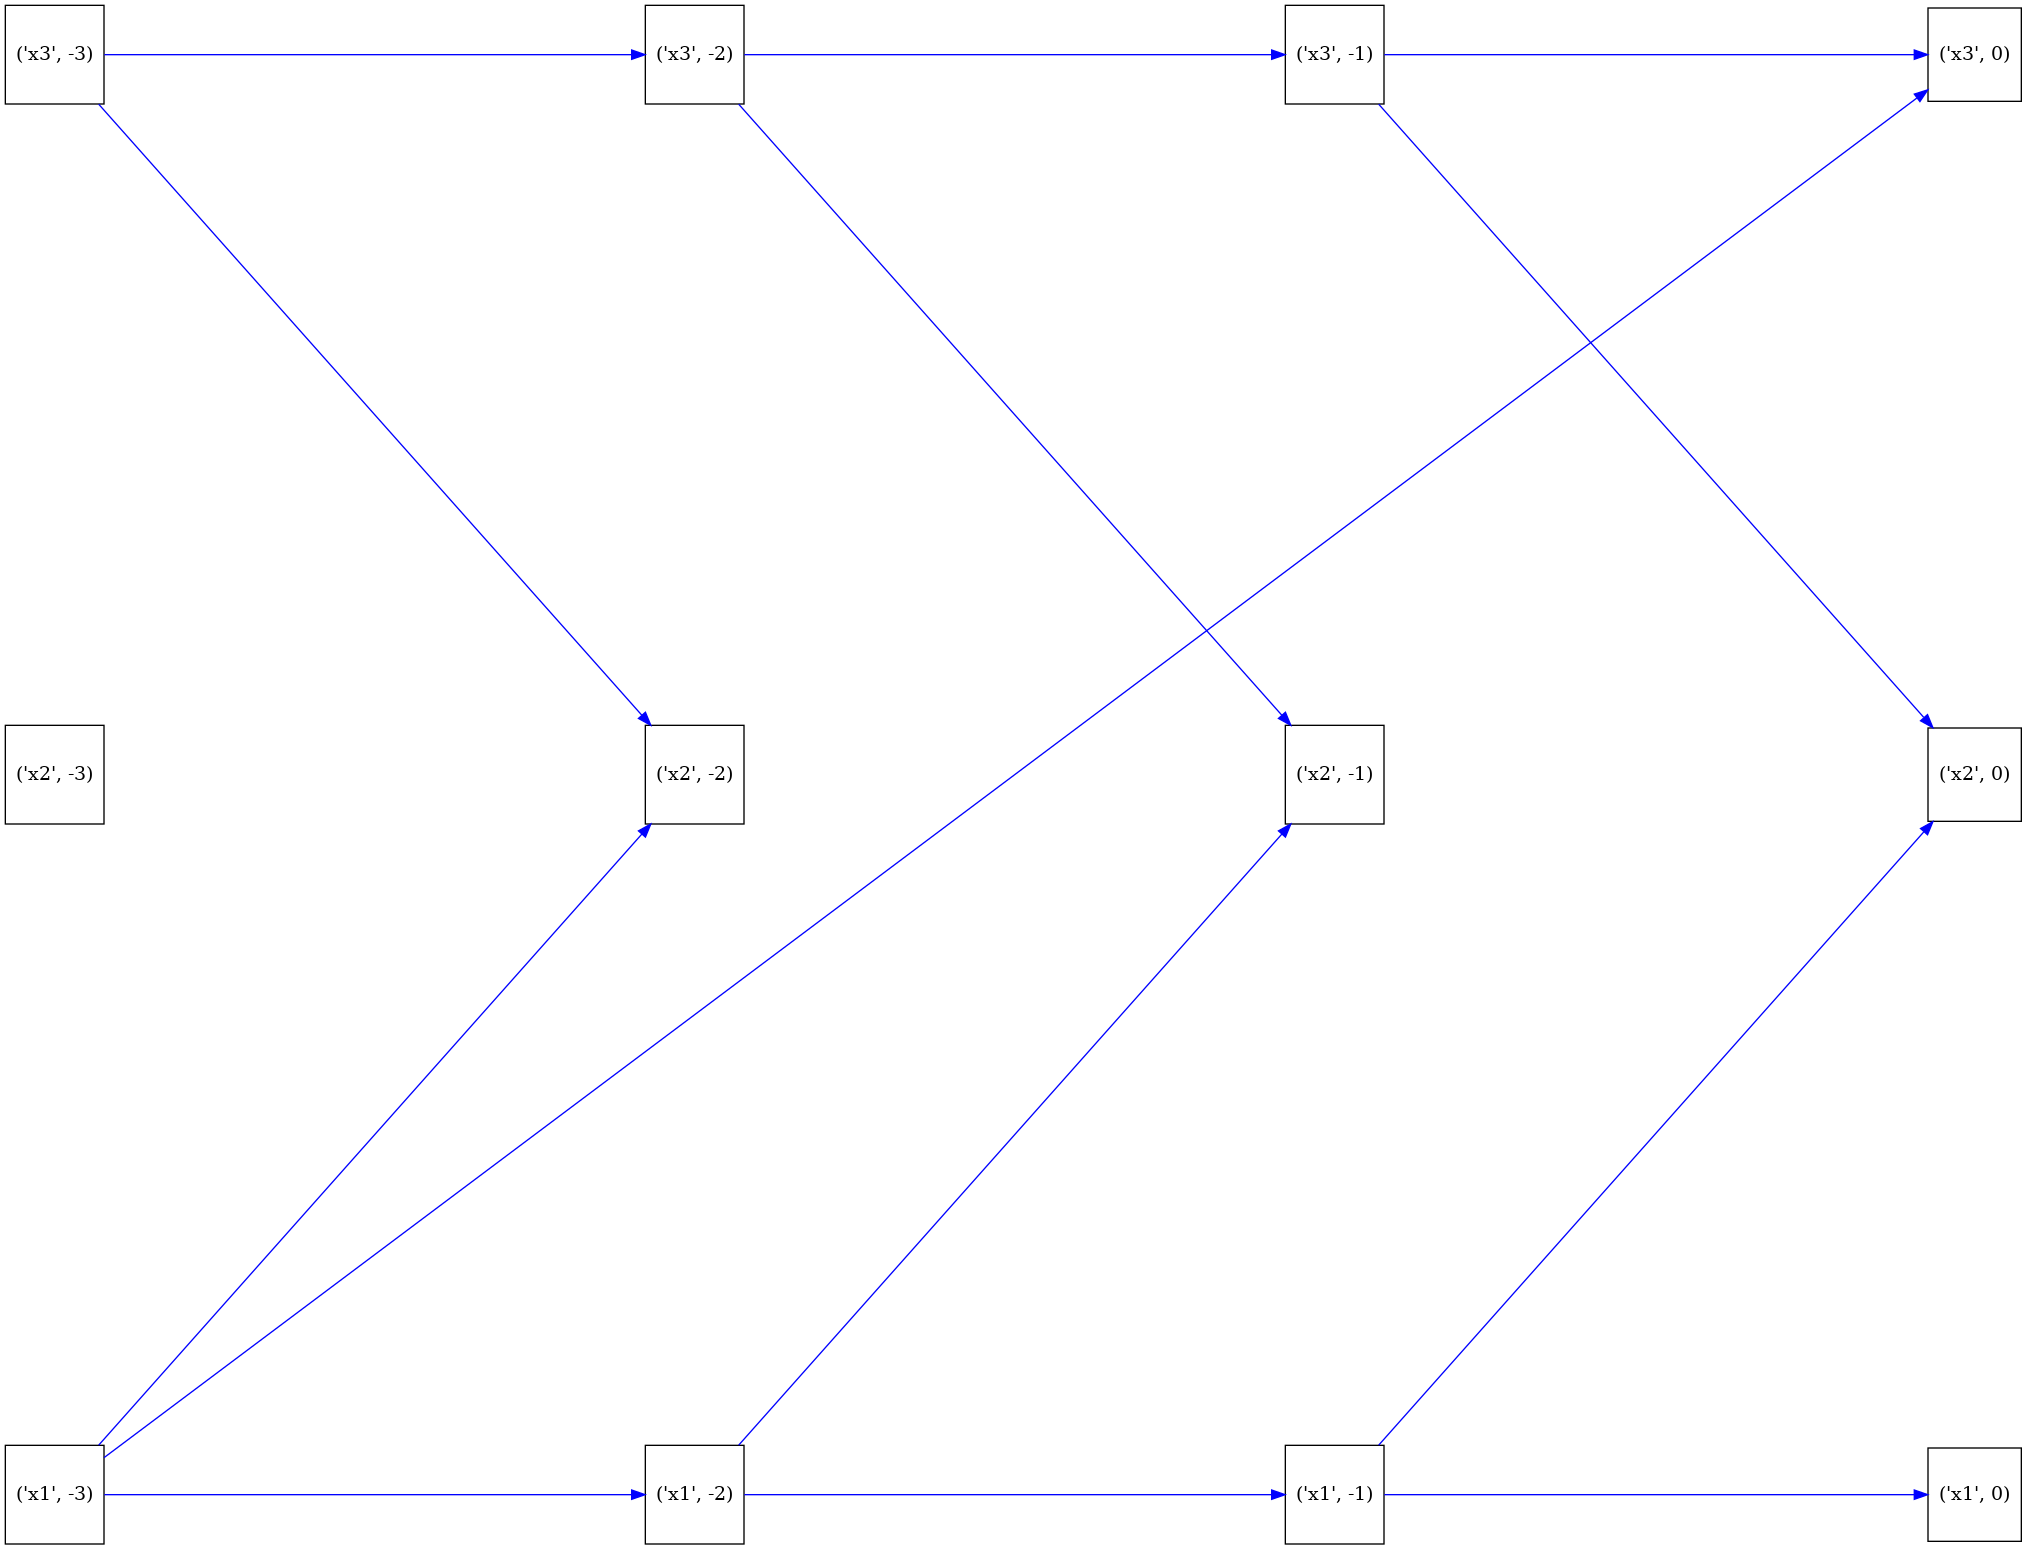
{('x1', 0): array([10. , -7.5]), ('x1', -1): array([ 3.33333333, -7.5       ]), ('x1', -2): array([-3.33333333, -7.5       ]), ('x1', -3): array([-10. ,  -7.5]), ('x2', 0): array([10.,  0.]), ('x2', -1): array([3.33333333, 0.        ]), ('x2', -2): array([-3.33333333,  0.        ]), ('x2', -3): array([-10.,   0.]), ('x3', 0): array([10. ,  7.5]), ('x3', -1): array([3.33333333, 7.5       ]), ('x3', -2): array([-3.33333333,  7.5       ]), ('x3', -3): array([-10. ,   7.5])}

'G.png'
Total running time of the script: (0 minutes 1.016 seconds)
Estimated memory usage: 166 MB